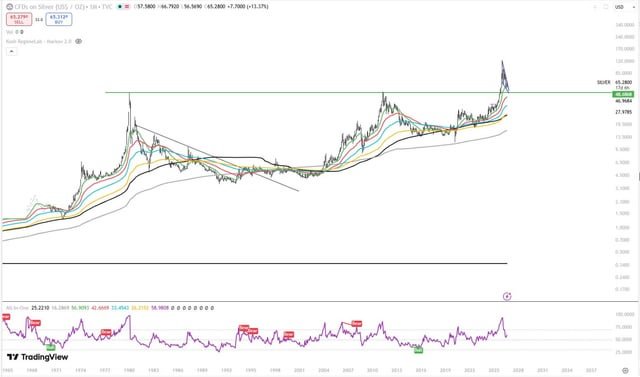
Looking at this monthly chart, the obvious question for me wasn’t “where does Silver go next?”
It was: what actually happened the other times Silver broke a major multi-year high?
So I tested a very simple rule on Silver futures (SI=F) from Aug 2000 onward:
enter after a monthly close makes a new multi-year high exit below the 10-month SMA next-bar execution 0.1% transaction cost
Then I changed only the breakout length.
3-year high: 7 completed trades : 5 winners
5-year high: 6 trades : 4 winners
10-year high: 3 trades : 2 winners
20-year high: 1 trade
The 20-year result is what surprised me most.
On a chart, a multi-decade breakout looks incredibly significant. Statistically though, you basically have no sample. One historical trade can’t tell you much about what happens next.
Even the shorter versions weren’t exactly comfortable max drawdowns were around 50%.
So I’m much more interested in the 3- and 5-year breakouts, where there’s at least some history to work with.
What would you test next here the size of the breakout, volume, macro conditions, or how Silver behaved 6–12 months after the signal?
submitted by /u/kush_patil
[link] [comments]
![[link]](https://i.redd.it/g2o3j5ajzcjh1.jpeg)
Leave a Reply