All aspects of “Technical Analysis” theories are purely of speculative expectations. One of the most popular signs of a bullish chart is the infamous “Cup and Handle” formation based on the historical price action. Typically this occurs as a price of the stock tests it’s resistant levels twice before finally breaking its resistance level.
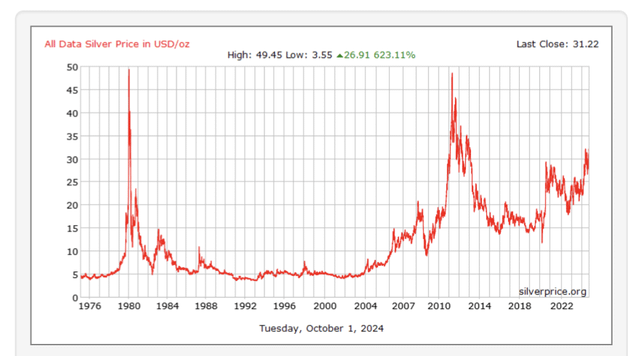
Most times this cup and handle formation occurs over the course of weeks, month, and sometimes even years. I now present to you the anomaly of all cup and handle formations, one that has occurred over several decades.
Silver!
Don’t be ridiculous though, I still count my stack in ounces. Not in fake money.
submitted by /u/TylusRoy
[link] [comments]
![[link]](https://i.redd.it/3r8fwzuxj9sd1.png)
Leave a Reply