TLDR:
– COMEX lost 4.2 million ounces of silver in a single day (Feb 10). Total inventory down to 386M oz, dropping at an accelerating rate. Only 101M oz is registered (deliverable).
– March open interest sits at 68,366 contracts (342M oz) — that’s 3.4x the registered silver available. First Notice Day is Feb 27.
– 2026 YTD deliveries already at 72.4M oz — more than double full Jan+Feb 2025 combined. February alone (a minor month) has delivered 23M oz.
– Physical shortages confirmed: Swiss dealers at zero inventory, UK coin shortages, US premiums at $88-90 for coins at $80 spot.
– January Employment Report (released today) was a bombshell — BLS revised 2025 total job growth from +584K down to just +181K. The labor market was 3x weaker than reported. Dovish for Fed, bullish for metals.
—
WHAT’S HAPPENING
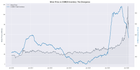
Silver is at $84.50 as of Feb 11, recovering from the crash low of $64 on Feb 2. The crash has been confirmed as a coordinated short attack — 6 groups of Chinese traders dumped 674 million ounces (3/4 of annual global production) on the Shanghai exchange. They’ve been banned. US Treasury Secretary Bessent publicly confirmed it was speculative activity from Chinese traders.
The fundamental picture was never challenged. In fact, it’s gotten tighter.
We are now 16 days from March First Notice Day (Feb 27), when we find out how many contracts stand for physical delivery. The math is getting uncomfortable for the short side.
Chart — Silver Price vs COMEX Inventory
—
COMEX INVENTORY: THE DRAIN IS ACCELERATING
– Registered: ~110M oz (Jan 6) → 101.4M oz (Feb 10) = -8.6M
– Eligible: ~316M oz → 284.9M oz = -31.1M
– Total: 426.5M oz → 386.3M oz = -40.2M (-9.4%)
40 million ounces have left COMEX vaults in 25 business days. But the pace isn’t steady — it’s accelerating:
– Jan 6-27: ~700K oz/day (175M oz/yr annualized)
– Jan 27-Feb 9: ~1.7M oz/day (425M oz/yr)
– Feb 10 (single day): 4.2M oz/day (1,050M oz/yr)
The Feb 10 withdrawals came primarily from JP Morgan (-2.14M oz eligible) and Loomis (-0.90M oz eligible). JP Morgan holds 43% of all COMEX silver (166M oz) but only 12% of registered.
At the current average drain rate (~1.6M oz/day), registered silver could be at 85-92M oz by First Notice Day.
Chart — COMEX Inventory Drain Projection
—
MARCH OPEN INTEREST: 3.4x REGISTERED
March OI at 68,366 contracts = 342 million ounces of paper claims against 101M oz of registered silver.
– Jan 27: 97,949 (31 days to FND)
– Feb 5: 80,502 / -5,317 (22 days)
– Feb 9: 73,128 / -2,963 (18 days)
– Feb 10: 68,366 / -4,762 (17 days)
The roll pace re-accelerated on Feb 10 — 4,762 contracts left March in one session, the biggest single-day exit since Feb 5. What remains are increasingly committed holders.
For historical context — March 2025 had ~100K contracts at this same stage (T-17) but 158M oz of registered silver. March 2026 has 32% less OI but 36-46% less registered silver. The ratio is tighter even with lower OI.
What could stand for delivery on Feb 27?
– Historical norm (5%): ~3,400 contracts / 17M oz = 17% of registered
– Elevated (7%): ~4,800 / 24M oz = 24%
– 2025-like (13%): ~8,900 / 44M oz = 44%
– High stress (20%): ~13,700 / 68M oz = 67%
– Extreme (30%): ~20,500 / 103M oz = 101% — exceeds registered
Chart — March OI Comparison 2022-2026
—
DELIVERY ACTIVITY: UNPRECEDENTED
February is a minor delivery month. Yet it’s already delivered 23M oz — surpassing many historical major months.
January deliveries: 2024: 6.8M oz / 2025: 11.8M oz / 2026: 49.4M oz
February (through Feb 10): 2024: 6.5M oz / 2025: 23.9M / 2026: 23.0M oz
YTD: 2024: 13.3M / 2025: 35.7M / 2026: ~72.4M
2026 YTD deliveries are already more than double 2025’s full Jan+Feb.
On Feb 10: Macquarie issued 100 contracts, JP Morgan stopped 63, Stonex stopped 26, Goldman stopped 9. JP Morgan is the dominant stopper — actively taking physical delivery.
Chart — Delivery Notices 2024 vs 2025 vs 2026
—
PHYSICAL MARKET SIGNALS
The paper market stress is now showing up in the physical world:
– SLV traded $32 billion in a single session — 15x normal volume. It surpassed SPY, NVDA, and TSLA to become the #1 most traded security on the planet.
– Swiss dealers at zero silver inventory. Metal disappears as soon as it arrives.
– UK 1oz coin shortages confirmed by multiple dealers.
– US premiums far above spot — $88-90 for coins at ~$80 spot.
– Shanghai premium: $8/oz above COMEX — persistent physical tightness in Asia.
– China silver trust trading at 100% NAV premium — suspended from further purchases.
– Family offices demanding physical over paper claims.
This is happening across 5 geographies simultaneously: US, UK, Switzerland, China, and broader Asia.
—
MACRO TAILWIND: TODAY’S EMPLOYMENT REPORT
The delayed January Employment Report dropped this morning and it’s a bombshell:
– NFP: +130,000 (weak)
– Unemployment: 4.3% (up from 4.0% a year ago)
– Prior month revisions: -17K net
But the real story is the benchmark revision:
– 2025 total job growth: Published +584,000 → Revised +181,000 (difference: -403,000)
– 2025 monthly average: 49K/mo → 15K/mo (3x weaker)
– March 2025 level adjustment: -898,000
The BLS just admitted 2025 was essentially a zero-growth labor market. Federal government employment is down 327,000 (-10.9%) since Oct 2024. This is strongly dovish for the Fed — rate cut expectations up, dollar down, metals up.
—
WHAT’S NEXT
Key dates:
– Feb 13 — January CPI Data (2 days)
– Feb 14 — COT release / updated positioning (3 days)
– Feb 25 — March Last Trade Day (14 days)
– Feb 27 — MARCH FIRST NOTICE DAY (16 days)
– Mar 2 — March First Delivery Day (19 days)
Price scenarios through May 31:
– Bear (deleveraging/rule changes): $50-78 — 10%
– Base (orderly but tight): $88-108 — 40%
– Bull (delivery stress): $108-145 — 35%
– Extreme (delivery failure): $145-200+ — 15%
What to watch:
– Feb 13 CPI — will it confirm the dovish tilt from today’s NFP?
– Daily March OI decline — are committed holders digging in?
– COMEX inventory — does the 4.2M oz/day drain continue?
– SLV volume — was the $32B session a one-off or a trend?
– Physical dealer restocking — or still dry?
16 days to First Notice Day. The clock is ticking.
—
Data sources: CME delivery reports, CME Silver_stocks.xls, Databento (daily OI), CFTC COT reports, BLS Employment Situation, OANDA price data, 113 expert transcripts across 63 speakers.
This is analysis based on publicly available data through February 10-11, 2026. All projections are scenario-based and conditional. Not financial advice.
submitted by /u/DeadlySecret
[link] [comments]
Leave a Reply